Zone Manager Backtest: Does It Actually Work?
The Challenge
This post follows on from the Zone Manager development story. Now that we have a working Zone Manager, let's put it through testing to see if it's really production-ready.
I wasn't 100% sure how to test the Zone Manager. It's not a pass/fail kind of metric. You wouldn't use S/R zones directly to place trades—they're informational, feeding data into a larger dataset for algorithmic trade decisions. So I can't use the typical "did the trade profit?" or "was this the correct entry time?" metrics.
What I came up with is a two-part validation test using my eyeballs and gut. Yes, I know that's nowhere near scientific enough, but I'm way out of my comfort zone for this type of data analytics. Let's learn by doing.
Test 1: Frozen Zones (No New Zone Creation)
Setup:
Test 1 uses the pre-built dataset from the last post. We already have 38 Support/Resistance zones from 6 months of historical data (Q1+Q2 2025, January through June). The zones ranged from $74,409 (extreme low) to $111,983 (extreme high).
Key constraint: We keep this data static—the Zone Manager cannot create any new zones.
Then we backtest against Q3 price data to see how often prices interacted with the zones and validate if our Zone Manager has created "good" support and resistance zones.
What I Expected
I thought we'd see drift in accuracy over time. I wasn't sure how long this would take, but it would be interesting to find out. This might also tell us if we should alter the zone refresh logic.
My guess: We'd see good results over the first 7 days or so. From that point onwards, accuracy would roll off because we're not creating any new zones.
I also realized we'd need a way to handle situations where prices move outside the S/R zone range by X%. At that point, the test would provide no relevant data since we have no zones covering the new price range.
Test 2: Zone Manager Running (Dynamic Zone Creation)
This test allows the Zone Manager to work as normal, producing new S/R zones based on Q3 2025 market data.
Critical concern: I need to make sure there's no look-ahead bias. The scars I gained from the Whipsaw post still haunt me today, so let's ensure there's no data leakage from the start.
What I Expected
Following on from my prediction in Test 1, I thought we'd see stronger S/R zones being tested and retested. This should provide more dominant S/R lines and clearer price action in these zones, further validating the Zone Manager is working correctly.
We shouldn't see any significant drift, and price action should be captured within the new Q3 S/R zones. This test should show a marked difference from Test 1 with the Zone Manager now running.
The Results: Round 1
Errrrr... um...
I wasn't sure what to expect, but it definitely wasn't this!
Looking at the first week breakdown, things looked rough. This should have been the best week, right? The results were all over the place!
So I did what any self-respecting techie would do—I asked Claude Code and Codex (ChatGPT) what this meant. Both are heavily involved in the project, doing the heavy lifting in the code. Both were like: "It's the clustering algorithm, 100% it's the clustering algorithm. The zoning is too tight. We can fix that in the code!"
Wait. Just a Minute.
Before we start tweaking the code—yes, this looks like a dumpster fire, but let's understand how we got these results before we start "fixing" things.
I agree it could well be the clustering algorithm. But we addressed a number of bugs in the last post, and I'm confident it's solid.
I've learned the hard way too many times that we can't just "tweak" the tolerances without understanding the problem first. No. Let's look at the data to see what's actually happening.
The Real Issue: Market Structure Changed
Interesting! I can see the issue straightaway. No need to look at the code.
Zone A in the chart below is where we built our S/R zones (Q1+Q2 2025).
Zone B is the backtest period (Q3 2025).
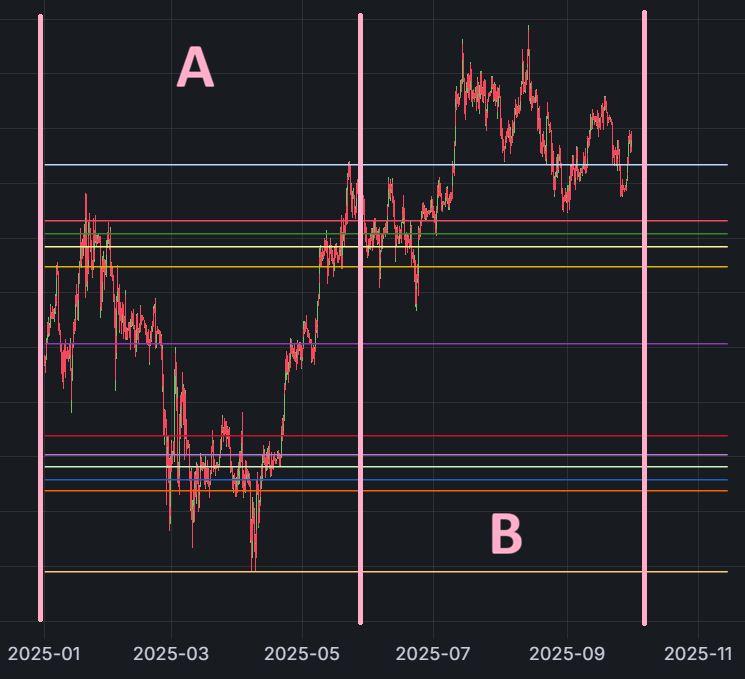
You can clearly see we're trending up out of the pre-built S/R zones. Not enough to fail the run with an "out of bands" error, but significant nonetheless.
The price had shifted UP 41.3% ($30,707 higher from the Q1+Q2 range)!
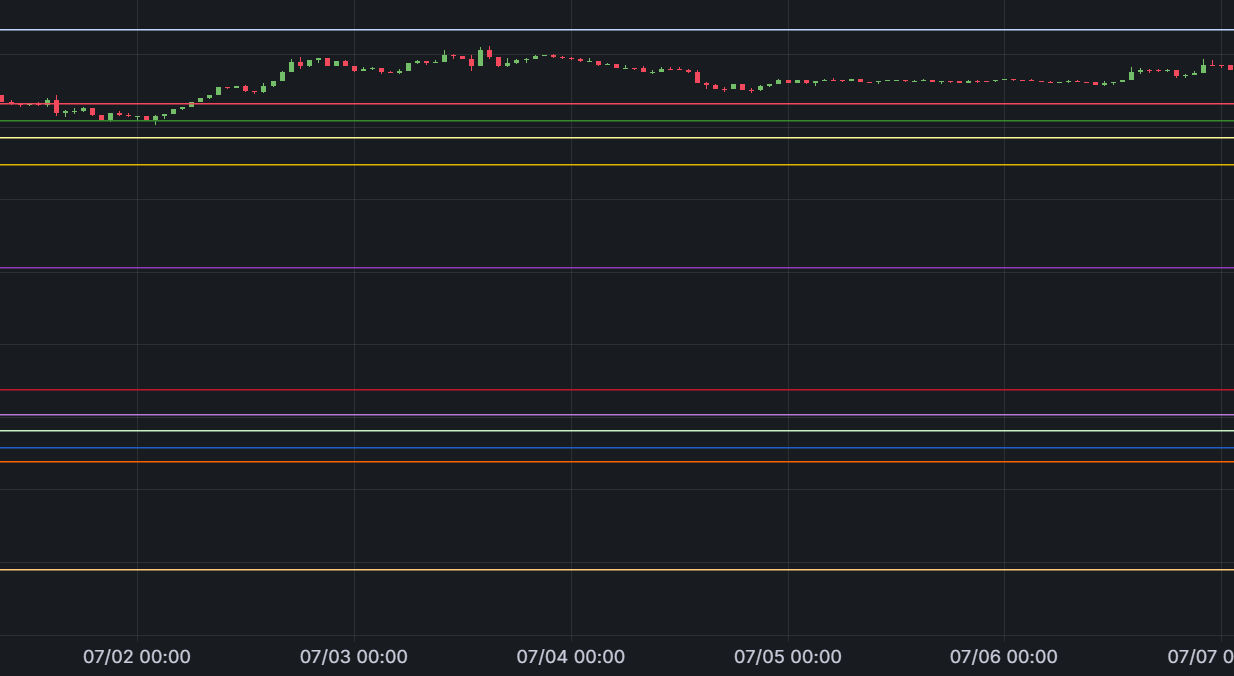
Visual Evidence
The chart shows that price stayed in a narrow range before evenly breaking up past our extreme high (grey line).
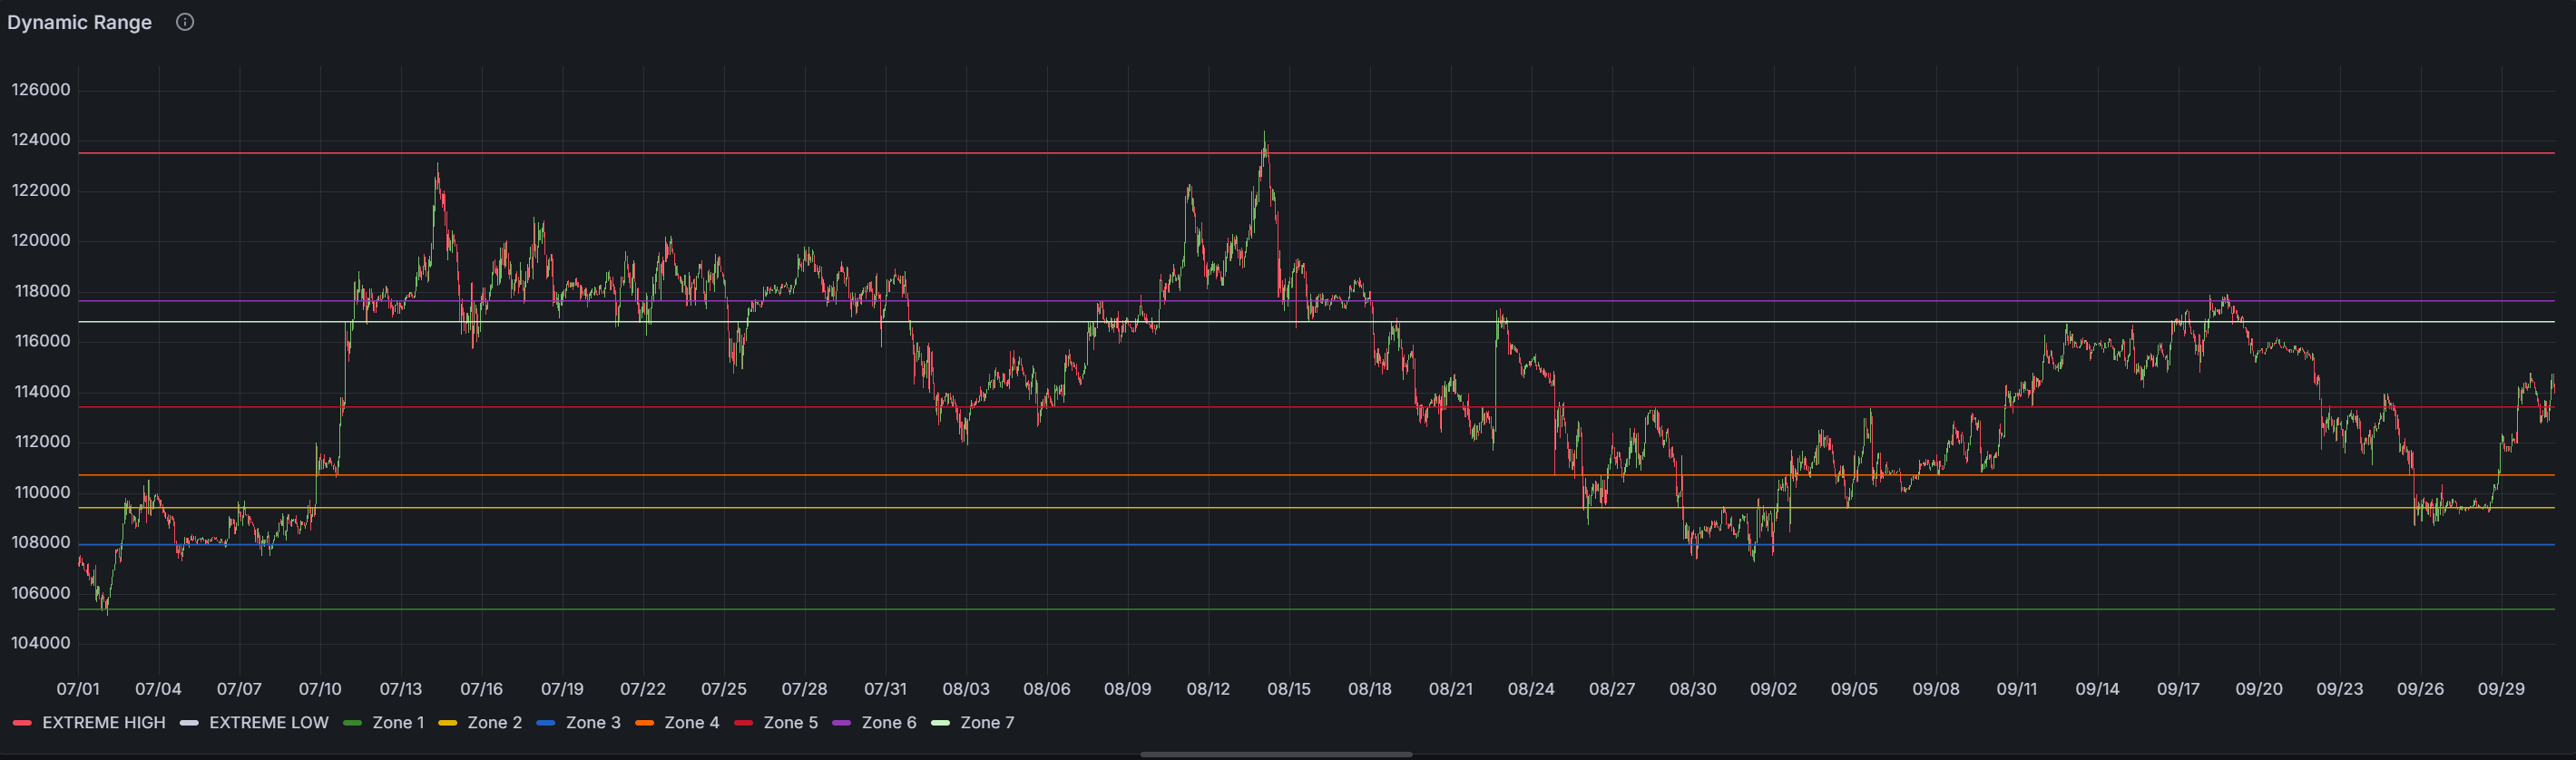
Zone Coverage Analysis
The breakdown shows that only 6 out of 38 zones (15.8%) were in Q3 price range:
- Zone 18602: $106,621 (strength 838) - 93 tests ✓
- Zone 18600: $105,423 (strength 736) - 70 tests ✓
- Zone 18601: $107,975 (strength 479) - 86 tests ✓
- Zone 18762: $109,440 (strength 417) - 69 tests ✓
- Zone 18763: $110,756 (strength 213) - 19 tests ✓
- Zone 18764: $111,715 (EXTREME HIGH, strength 141) - 6 tests ✓ (grey line)
This means 32 zones (84.2%) were below $105K and never tested in Q3.
The Revelation
OK, this is not looking so bad after all.
My takeaway from this test: Where we had S/R zones, we saw Q3 price action interact with those zones. You can see this with the red and grey S/R lines on the charts.
The real issue is that the market moved into a new price range. Our zones weren't wrong—they just weren't where the market went.
Test 2: Unleash The Zone Manager
Let's try the same run but with the Zone Manager running, creating new S/R zones and adding strength to existing zones.
What I Expected
I expected all the S/R zones to shift around in the Grafana chart because we only display the top zones by strength. Since we're adding more strength and creating new zones, the displayed zones should definitely change.
The Results
The output results were as expected. The dynamic test (where we allowed the Zone Manager to update and create new S/R zones) saw an increase from 38 to 46 zones—10 new zones added during Q3:
- Week 2: +5 zones (price moved into $108K-$110K range)
- Week 3: +2 zones (continued uptrend)
- Week 5: +1 zone
- Week 7: +1 zone
- Week 8: +1 zone (final zone at $120K+ range)
After week 8, no new zones were created—the market stayed in a range that was already covered.
This shows the Zone Manager isn't creating zones randomly. It creates them when new swing highs/lows appear, then stops when coverage is sufficient.
The Bug I Found (And Fixed)
Before I show you the final results, I need to address the bug in the room, I mean code 😄
When I first ran Test 2, both static and dynamic showed 0% bounce rate. That's obviously wrong. The zones can't be that bad.
Turns out, the test script had a bug in the bounce detection logic. The code was marking everything as "broke" without checking direction. If price hit support at $100K and went back up to $102K, it would mark that as "broke" instead of "bounced."
I fixed the logic to properly check direction:
- Support bounce = price came down, then went back up ✓
- Resistance bounce = price came up, then went back down ✓
After fixing the bug and re-running, here's what we got.
Final Results
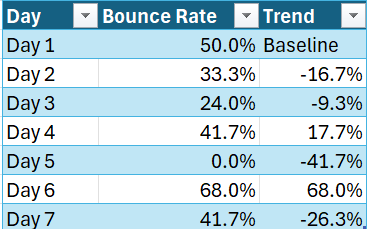
Test 1 (Static Zones): 37.4% bounce rate
- Only 6 zones in Q3 price range
- Market had moved up 41% from training range
- 53% hovering rate (zones too wide for 7-day test)
- We were testing outdated zones, not zone effectiveness
Test 2 (Dynamic Zones): 59.5% bounce rate
- 46 zones covering Q3 price range (Zone Manager running as designed)
- Zones created at new price levels as market moved
- 26% hovering rate (better because longer test period)
- We were testing zone effectiveness, not zone relevance
Note: Bounce rate = how often price respects the S/R zone (bounces off it instead of breaking through).
What This Means
The improvement from 37.4% to 59.5% (+22.1 points) is not because we changed the algorithm. It's because we let the Zone Manager work as designed instead of artificially freezing zones.
Test 2 ran for 3 months (92 days) with 3,474 zone tests. The 59.5% bounce rate held consistently week after week.
Conclusion
I'm feeling more confident with the outputs from the Zone Manager.
I think I've been expecting to find some critical issue that was tricking me with "good results" when in reality it was junk. But the more I look at the logic in the Zone Manager, the more I feel it's working as I planned it to.
The real lesson from Test 1 wasn't "the Zone Manager is broken." It was "the market moved, and our frozen zones couldn't follow."
Test 2 proved that when we let the Zone Manager do its job—creating zones as new swing highs/lows appear—we get consistent, reliable S/R zone detection with 59.5% accuracy.
Key Takeaways
1. No Zone Manager = Blind Spots
59.5% accuracy is strong. If the market stays in range, static zones work fine. But when the market trends up 41% in 3 months, static zones go blind. We need to keep zones actively updated.
2. 59.5% Is a Real Edge
This isn't random. 3,474 tests over 3 months across all market conditions produced consistent 59-60% accuracy. I guess this is why traders use support and resistance lines.
3. The Market Moved, Not the Zones
Test 1's 37.4% wasn't a failure—the zones were fine. The market just moved. Test 2 proved it by showing 59.5% when the Zone Manager was allowed to create new zones.
4. Grafana to the Rescue
Without visualization, I'd have spent weeks in the code rabbit hole of pain. With Grafana, I could see the problem instantly: market structure had changed, the zone logic was fine.
What This Means for D-Limit
We now have a working S/R zone system that:
- Provides 59.5% predictive accuracy on price bounces
- Adapts dynamically to trending markets
- Creates zones only when needed (10 zones in 3 months)
- Works across different market conditions
The Zone Manager is ready for production integration.
Status: ✅ Complete
This is part of the D-Limit v3 development series. See also:
- Zone Manager: The Engine Behind D-Limit's Magnetic S/R